The Acme Conglomerate
Acme Manufacturing is one of the most diverse industrial conglomerates imaginable. We make food, metals and vehicles for a generous proportion of the Global market. We have embraced Smart Manufacturing and Digital Transformation across our entire supply chain. This empowers us to make the safest, highest quality products possible with unprecedented transparency.
Acme Food and Beverage makes a wide range of food products for some of the worlds most recognized brands. Making food is all about trust. The Smart Manufacturing Innnovation Platform (SMIP) allow us to practice continuous manufacturing with the highest yields, lowest cost and least variance.
Acme Automotive makes vehicles that defy the imagination. Acme Automotive is a fully integrated discrete manufacturing business unit where we design, build and deliver nearly 1 million vehicles per year.
Acme Metals and Mining, is a metal sourcing, forging, fabrication and processing of metals for our own and others' automotive businesses,
With our ThinkIQ system, we run a supply chain that is efficient, sustainable, resiliant and agile. Our mantras are Quality, Reliability and Trust.
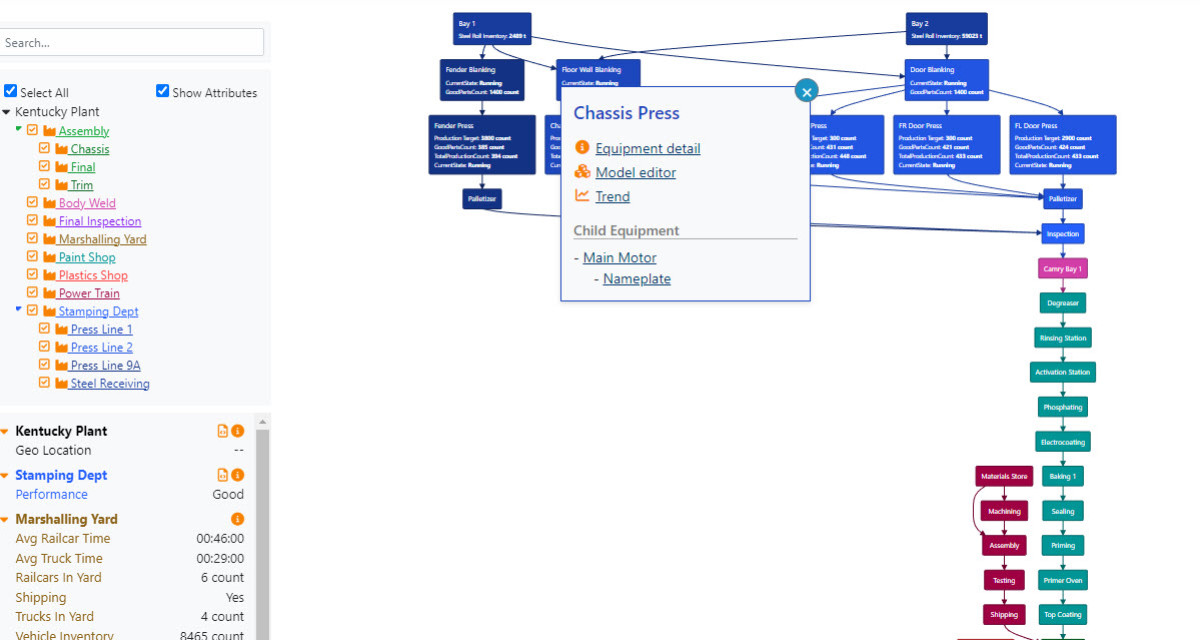


Process Layout
The Process Layout diagram is a great place to start using the platform. You don’t have to search for data by cryptic tag names or ERP codes. The Process Layout Diagram lets you visualize the physical layout of the process. From the diagram you can go directly to any of the data related with physical equipment and examine the flow of materials through the equipment. 
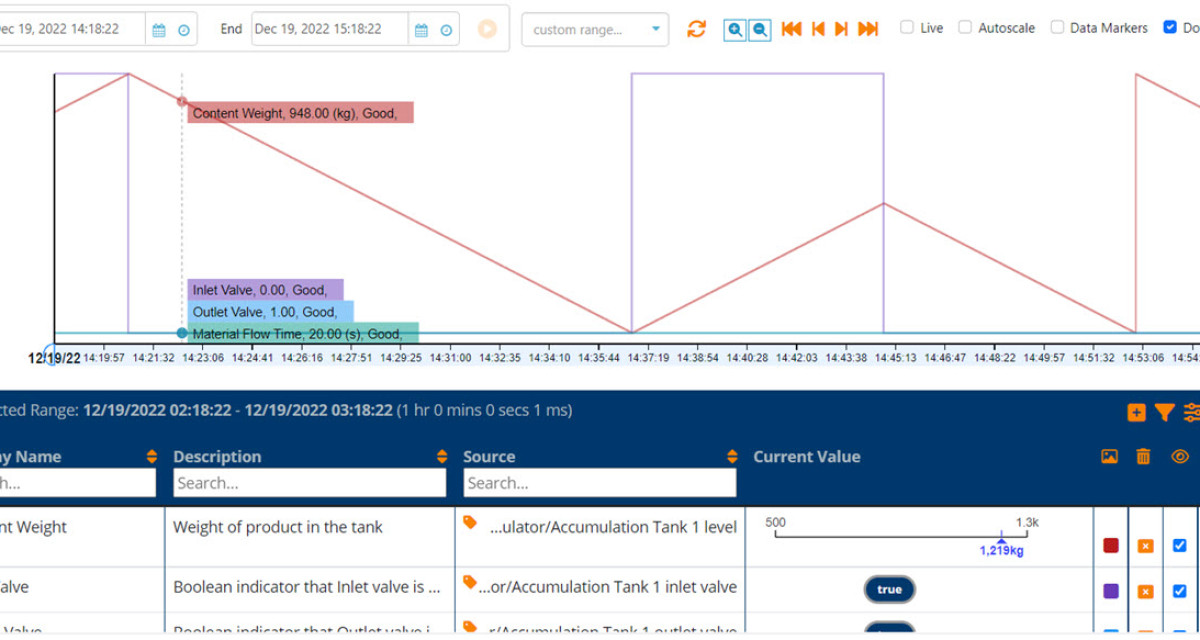
Trending
It is often useful to explore the underlying time series data. Trend allows you to do this through the lens of the Model. Users with no knowledge of the underlying source systems and their tags can search for and visualize any real-time and historical data. These data are stored into a powerful cloud database and can be accessed using many tools. The Trend App is a good place to begin exploring the data.

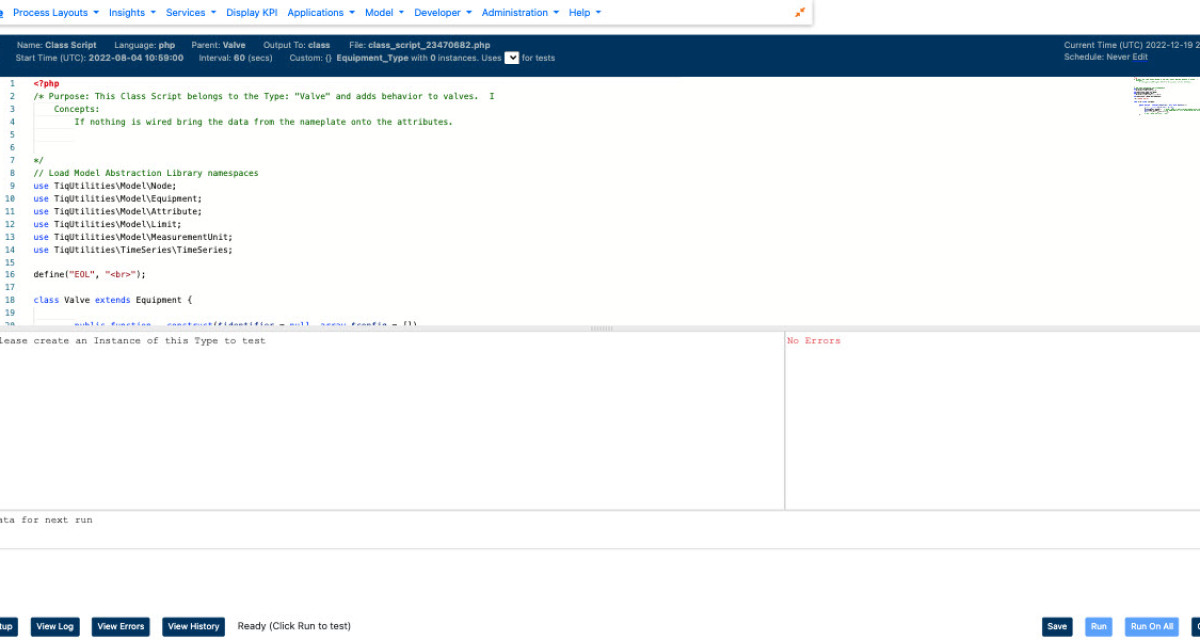
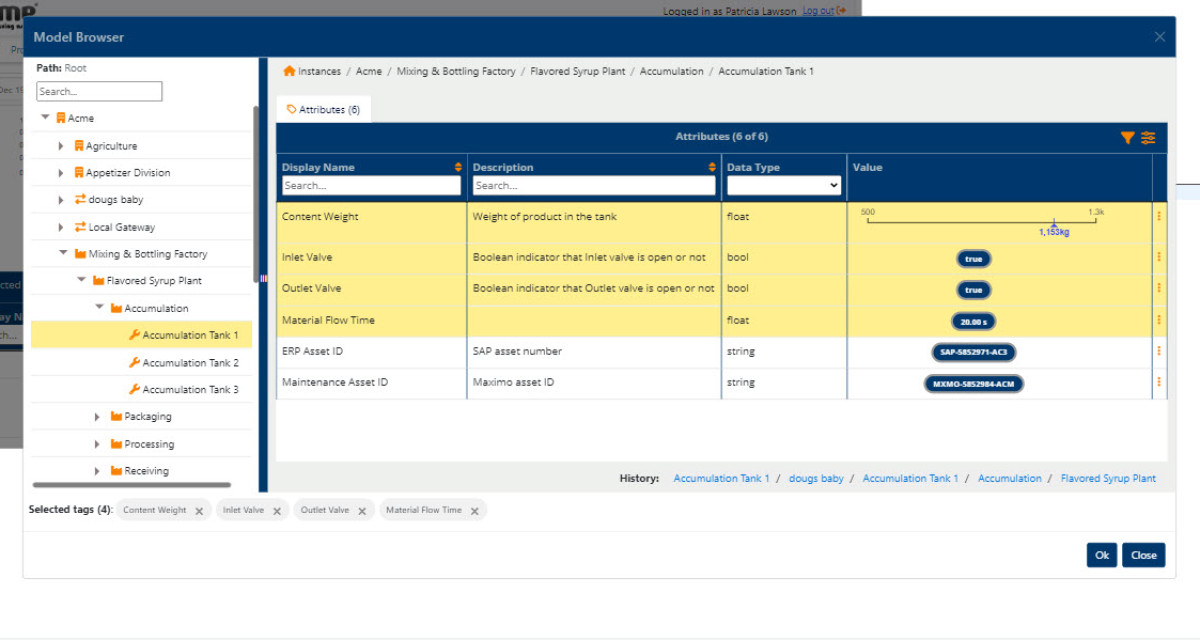
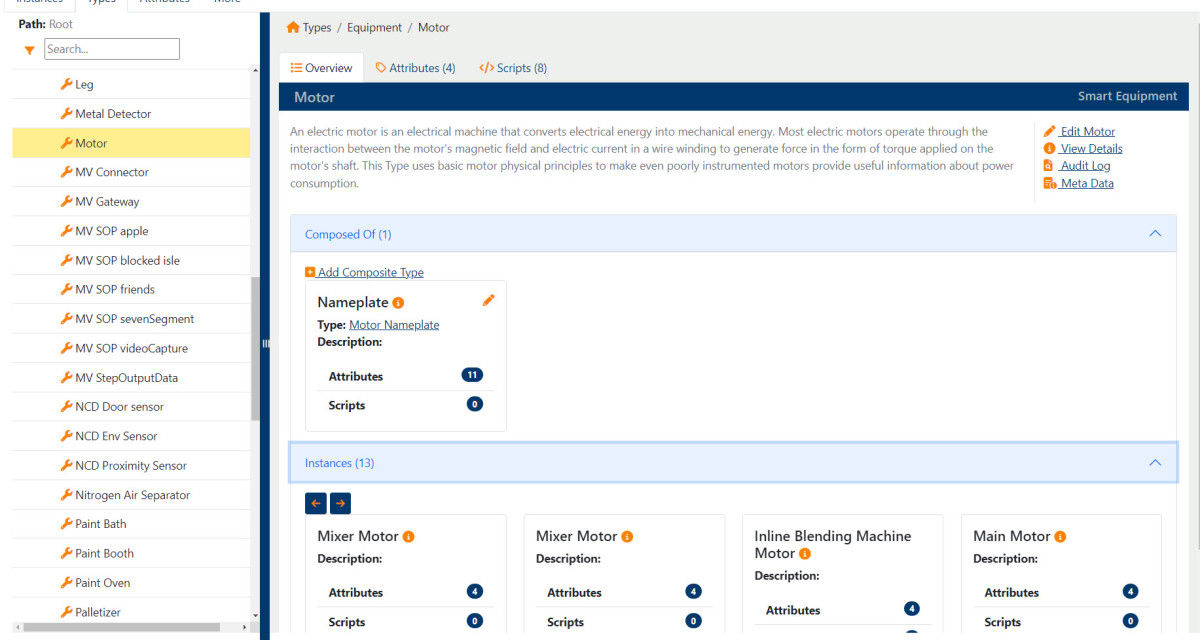
Model Explorer
The value of the raw data from on-premise is greatly enhanced by the equipment model. This is where we define the various equipment and what measurements are associated with the equipment. This is also where the relationships between equipment items are defined. Relationships include defining how the equipment items are connected to one another from a perspective of material flow through the process. Most users do not need to edit the model but rather can see the information using the Equipment Details page
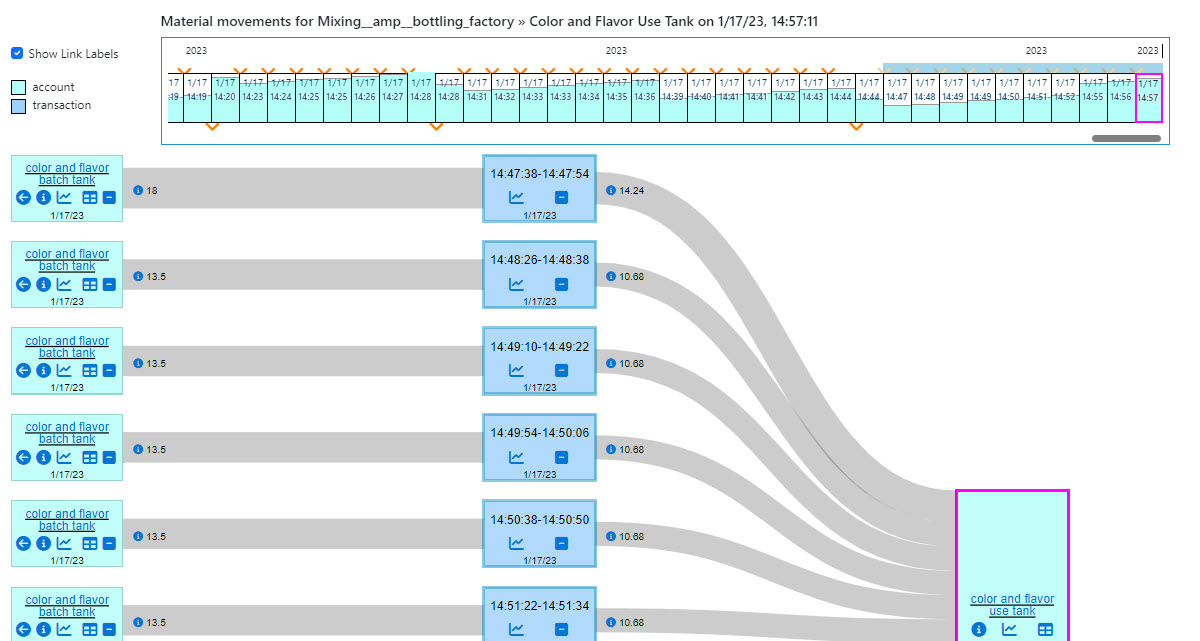
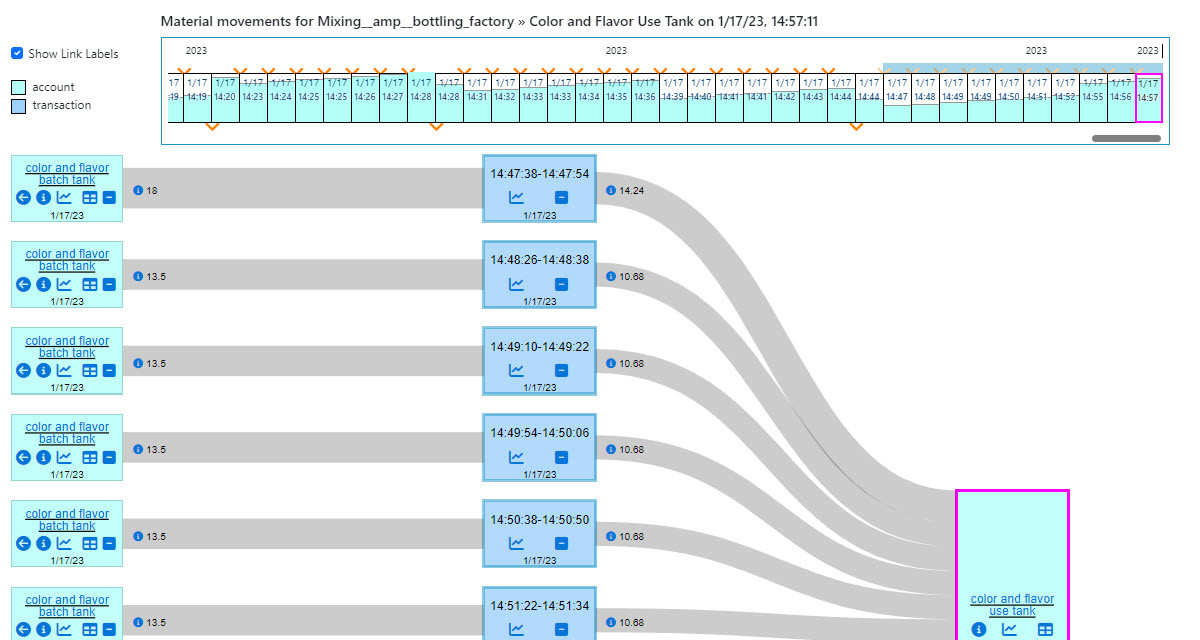
Material Flow Diagram
The real value of this platform shines when you start to use the Material Flow Diagram. Under the hood the platform is constantly monitoring the sensor values for each item of equipment to find the patterns that tell it that materials have moved in or out of that piece of equipment. The system then uses the Semantic Model to match the inflows and outflows to determine flow through the entire supply chain. Attributes associated with the material movement (usually quality data) are intelligently propagated with the movement. All this information is stored into the Material Ledger, a set of structures and code that allow us to:- React quickly to any anomalies in our operations. Stable operating conditions result in predictable patterns in the Material Ledger. Deviations from these patterns are detected and alerts are raised to let us know we are “off the happy path”.
- Respond with precision. When things go wrong and materials in the supply chain do not meet our exacting standards the ledger allows us to see exactly where those materials have propagated to downstream and recall/rework appropriately.

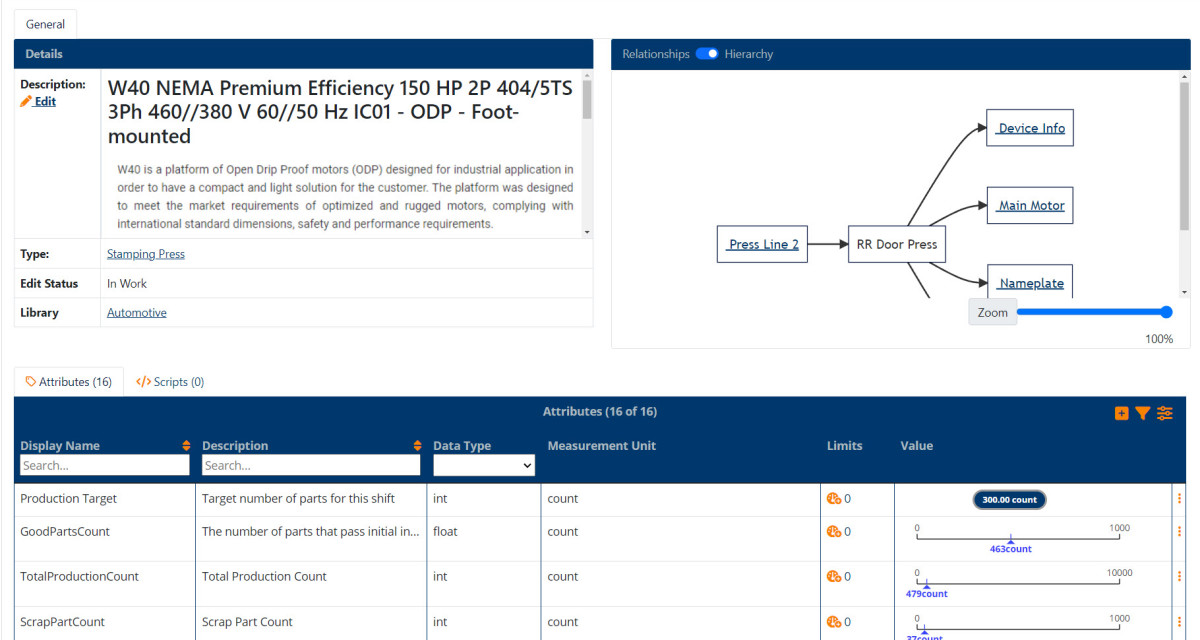
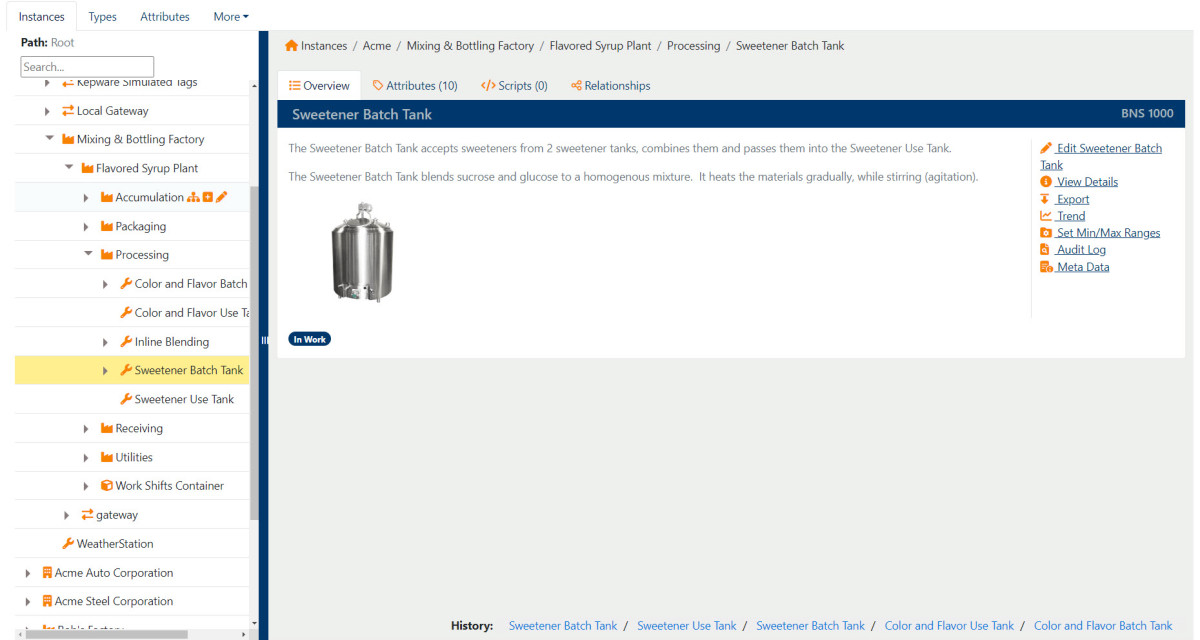
Equipment Details Diagram
The Equipment Details Diagram provides essential information about the specific equipment selected. The dashboard displays details about the equipments' relationship to other equipment, it's operational state, and visual indicators of the equipment's operation over the last hour including whether or not the equipment is operating within limits. From the dashboard it is possible to open a Trend diagram, the Material Flow diagram, and the Model Editor with focus on the selected equipment.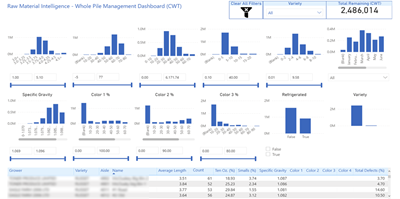
Reporting and Analytics
Reporting and Analytics are the tools provided to create insights from the data and contextual information. The platform provides several tools to create insights from data, including:- SQL. Under the hood all the data is a modern scaled database that supports structured data, graph data and documents. Not only is the full power of the database at your call, but you can also take advantage of functions that greatly enhance the ability to make sense of time-series data.
- The Model API. If you need to access or create data in the platform from other applications this secure REST interface is for you.
You are a Guest.